Table of Content
To skip the long article, watch the presentation video here:
Using R for Regulatory Stress Testing Modeling (21’11”)
I. Project Overview
- 2008 Financial meltdown due to asset securitization and overleveraging
Response in form of regulatory requirements for Bank Holding Companies
- Dodd-Frank Act supervisory stress testing (DFAST) - BHCs of $10-$50 BN Total Assets must provide forward-looking stress tests of their capital strcuture in-house
- Comprehensive Capital Analysis and Review (CCAR) - Further to DFAST requirements, BHCs of more than $50 BN Total Assets are also subject to Fed-conducted stress tests which must be publicly-disclosed.
Both programs assess whether:
- BHCs possess adequate capital to sustain macro and market shocks while still meeting lending needs without need of government capital injectionjs
- Capital posisions fall below ratio thresholds under 3 hypothetical scenarios: Baseline, Adverse, and Severely Adverse
S&P Global Market Intelligence, in collaboration with Columbia University MS&E program, has made an endeavor in developing a solution to model the risks
II. Methodology
The project followed multiple interations of of exploratory data analysis, data transformation and imputation, modeling & analysis, testing and business fine tuning.
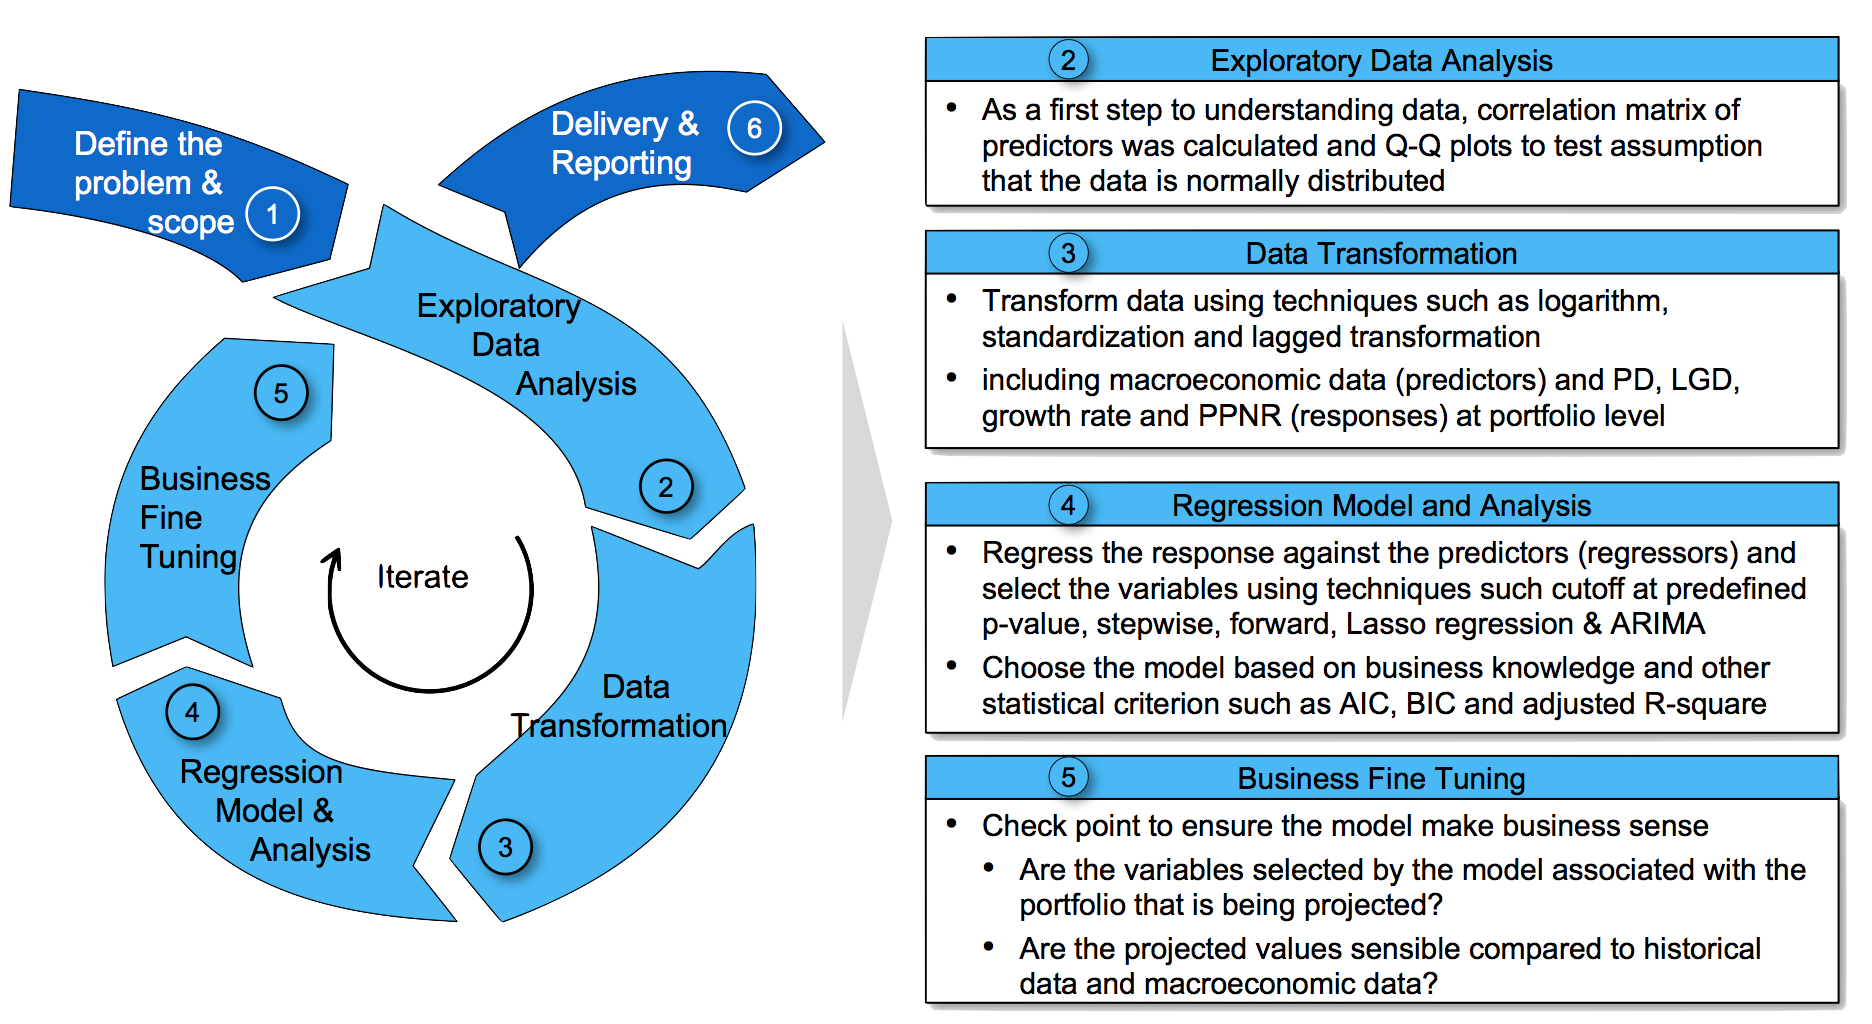
Figure 1 - Methodology
III. Data Description
In the light of Capital and Loss Assessment under Stress Scenario (CLASS) Model, prepared by the Federal Bank of New York Staff, it’s decided to have the following proxies to be modeled:
| Ratios Required by Federal Reserve | Proxies |
|---|---|
| Probability of Default (PD) | Probability of Default Model |
| Loss Given Default (LGD) | Loss Given Default Model |
| Exposure at Default (EAD) | Growth Rate Model |
| Pre-Provisioin Net Revenue |
|
The data was transformed into panel form by aggregating data points for all banks as well as the macro-econmic data. With the panel data, it’s expected to forcast ratios from 2016 to 2020 for the pre-defined proxies.
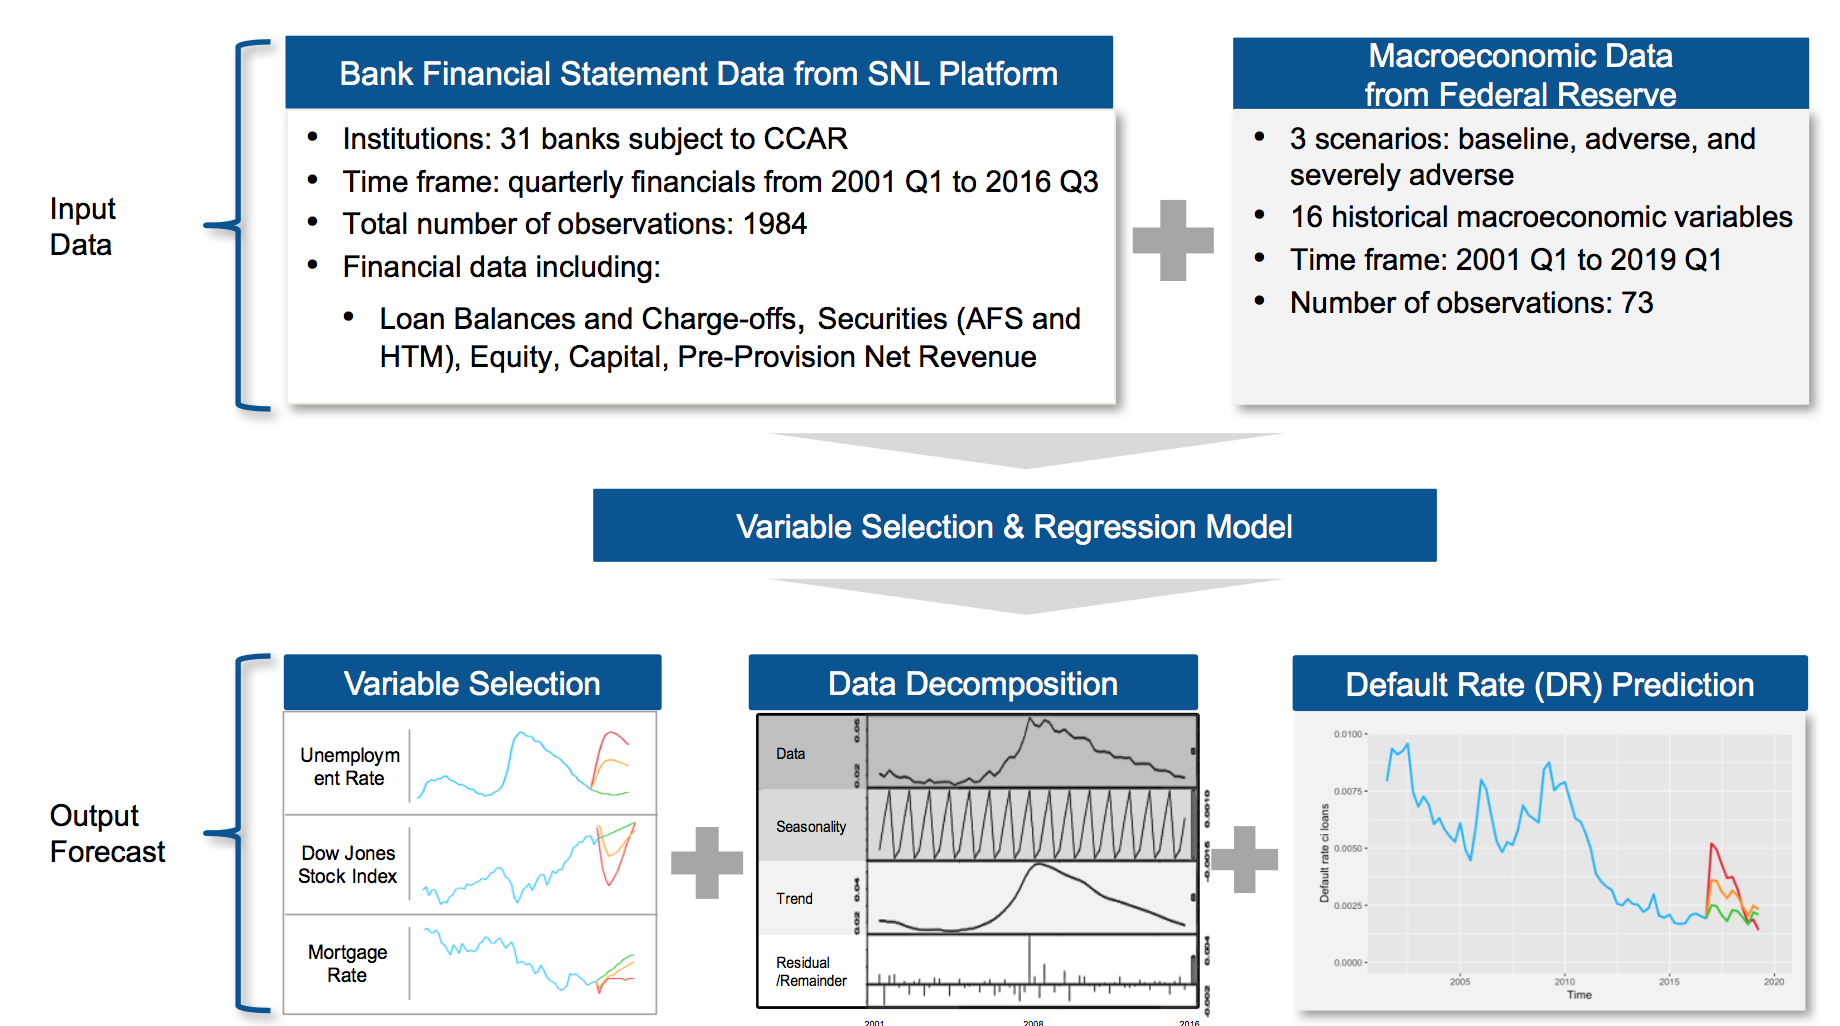
Figure 2 - Some Meta Data of Data
IV. Exploratory Data Analysis & Data Transformation
As mentioned in Data Description, the predictors will be derived from macro-economic data while the “y” values will be derived from financial statement data. Note that some key assumptions were made in the data transformation.
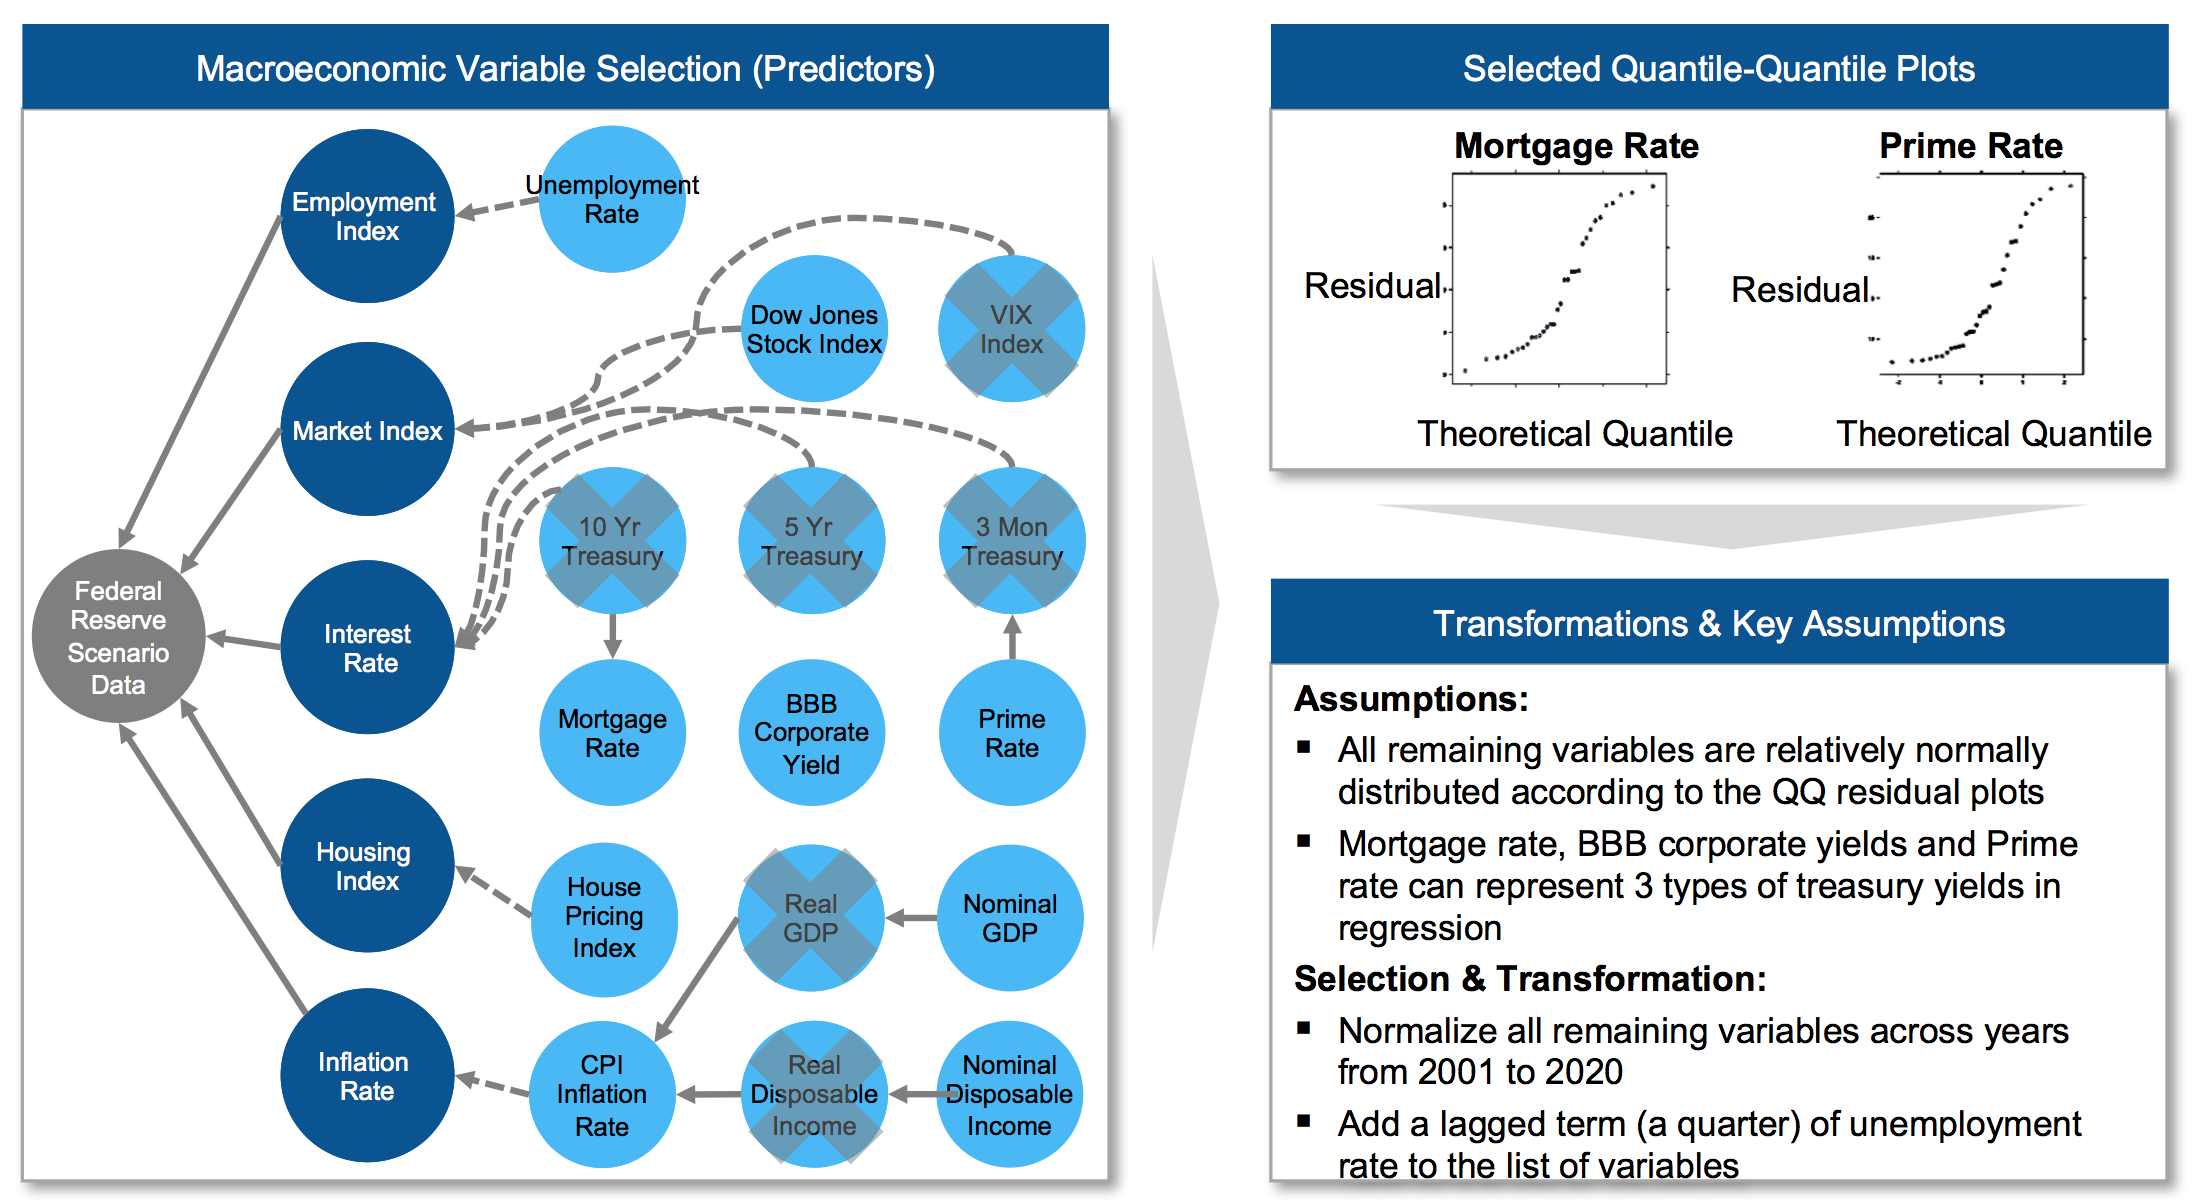
Figure 3 - Variable Selection from Macro Data
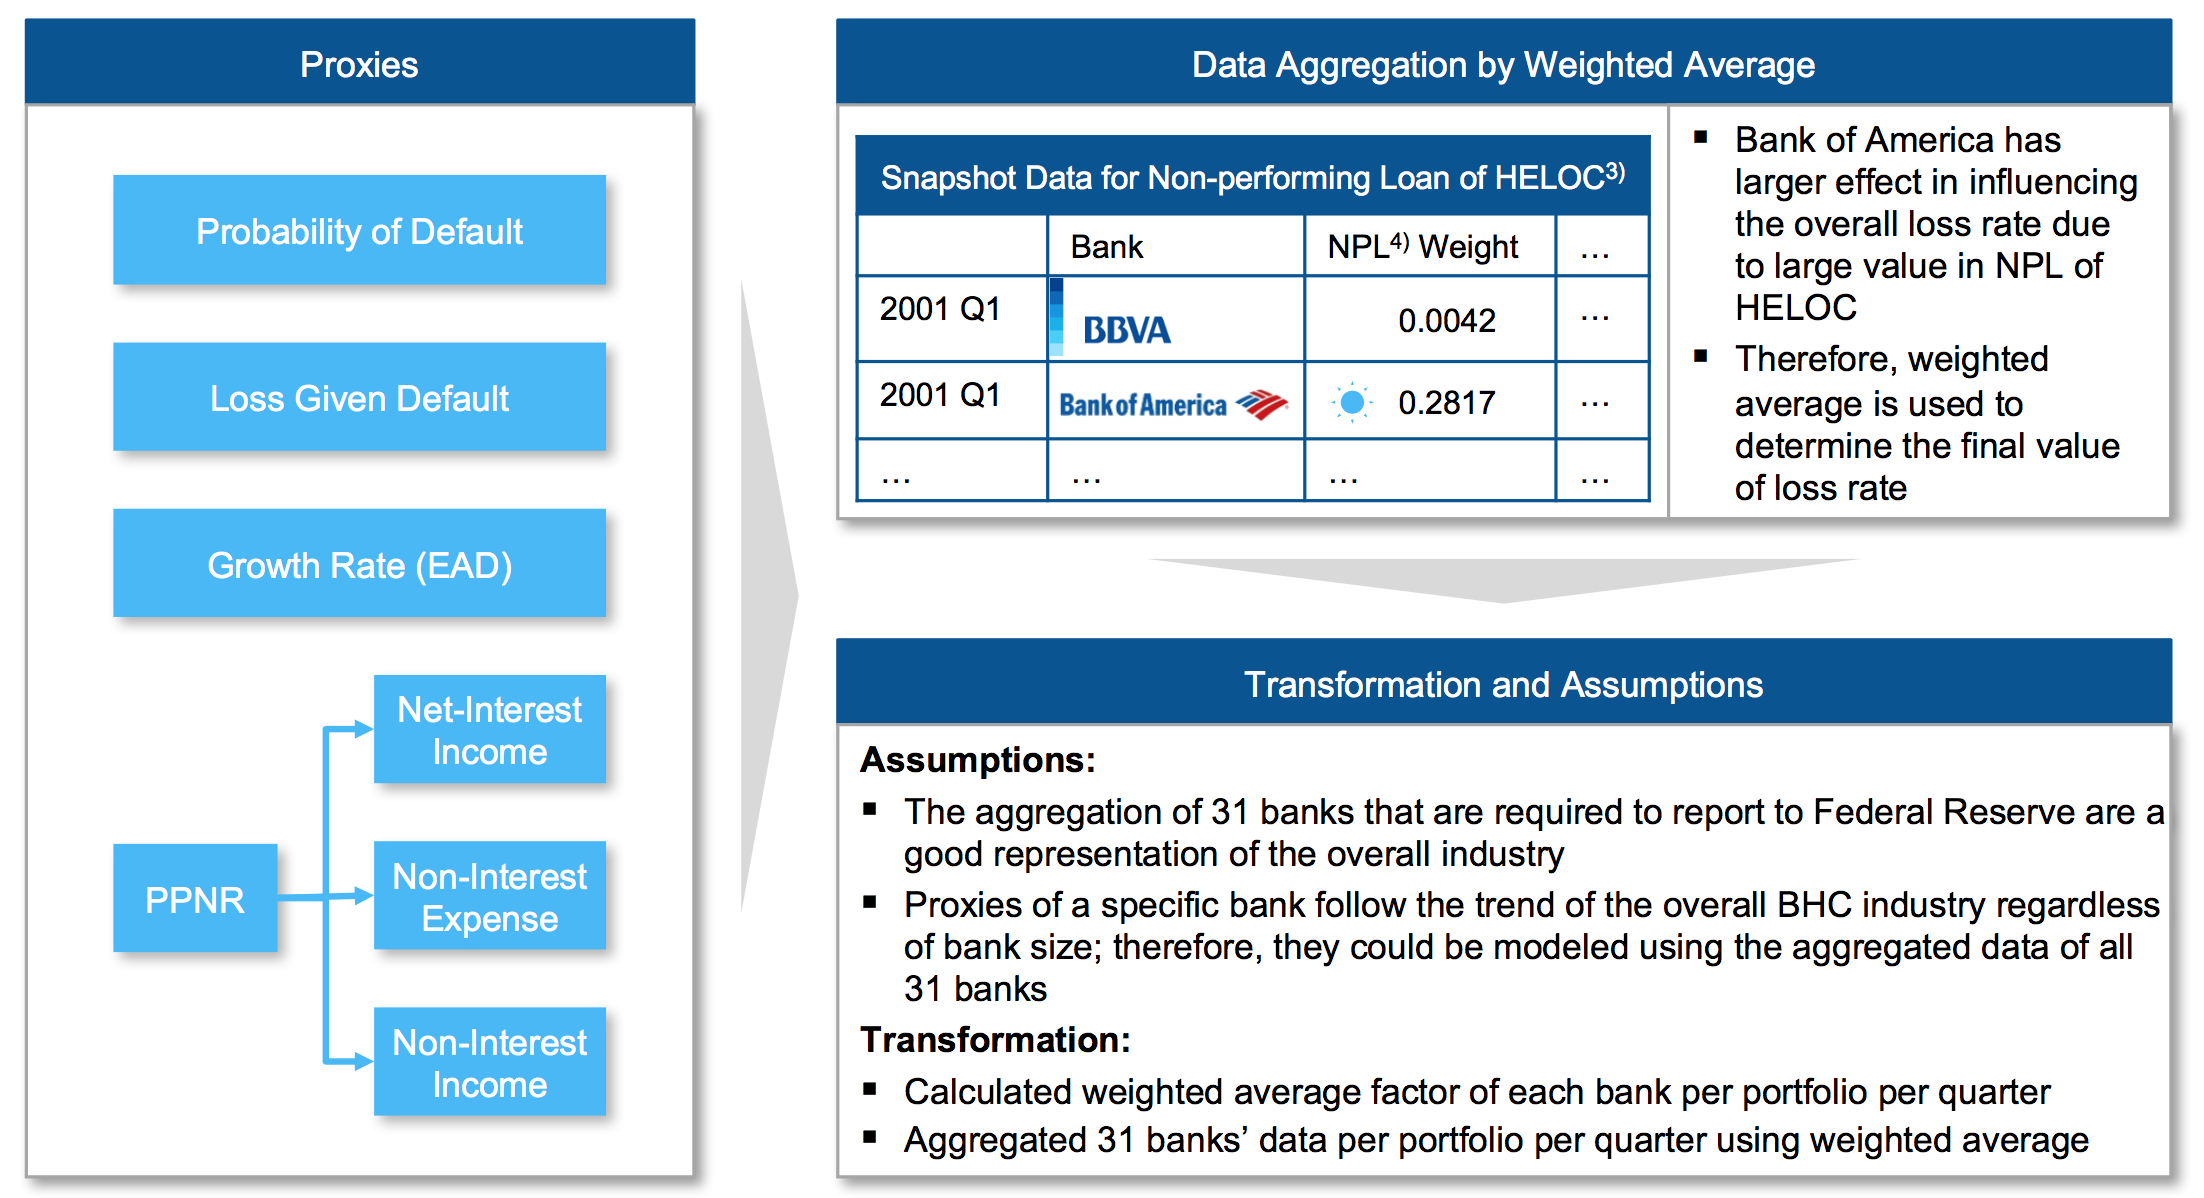
Figure 4 - Data Transformation of Historical Bank Data
V. Model Selection
ARIMA has been chosen to be the champion model: remaining models violated iid principle (independent and identically distributed) while error terms showed strong autocorrelations.
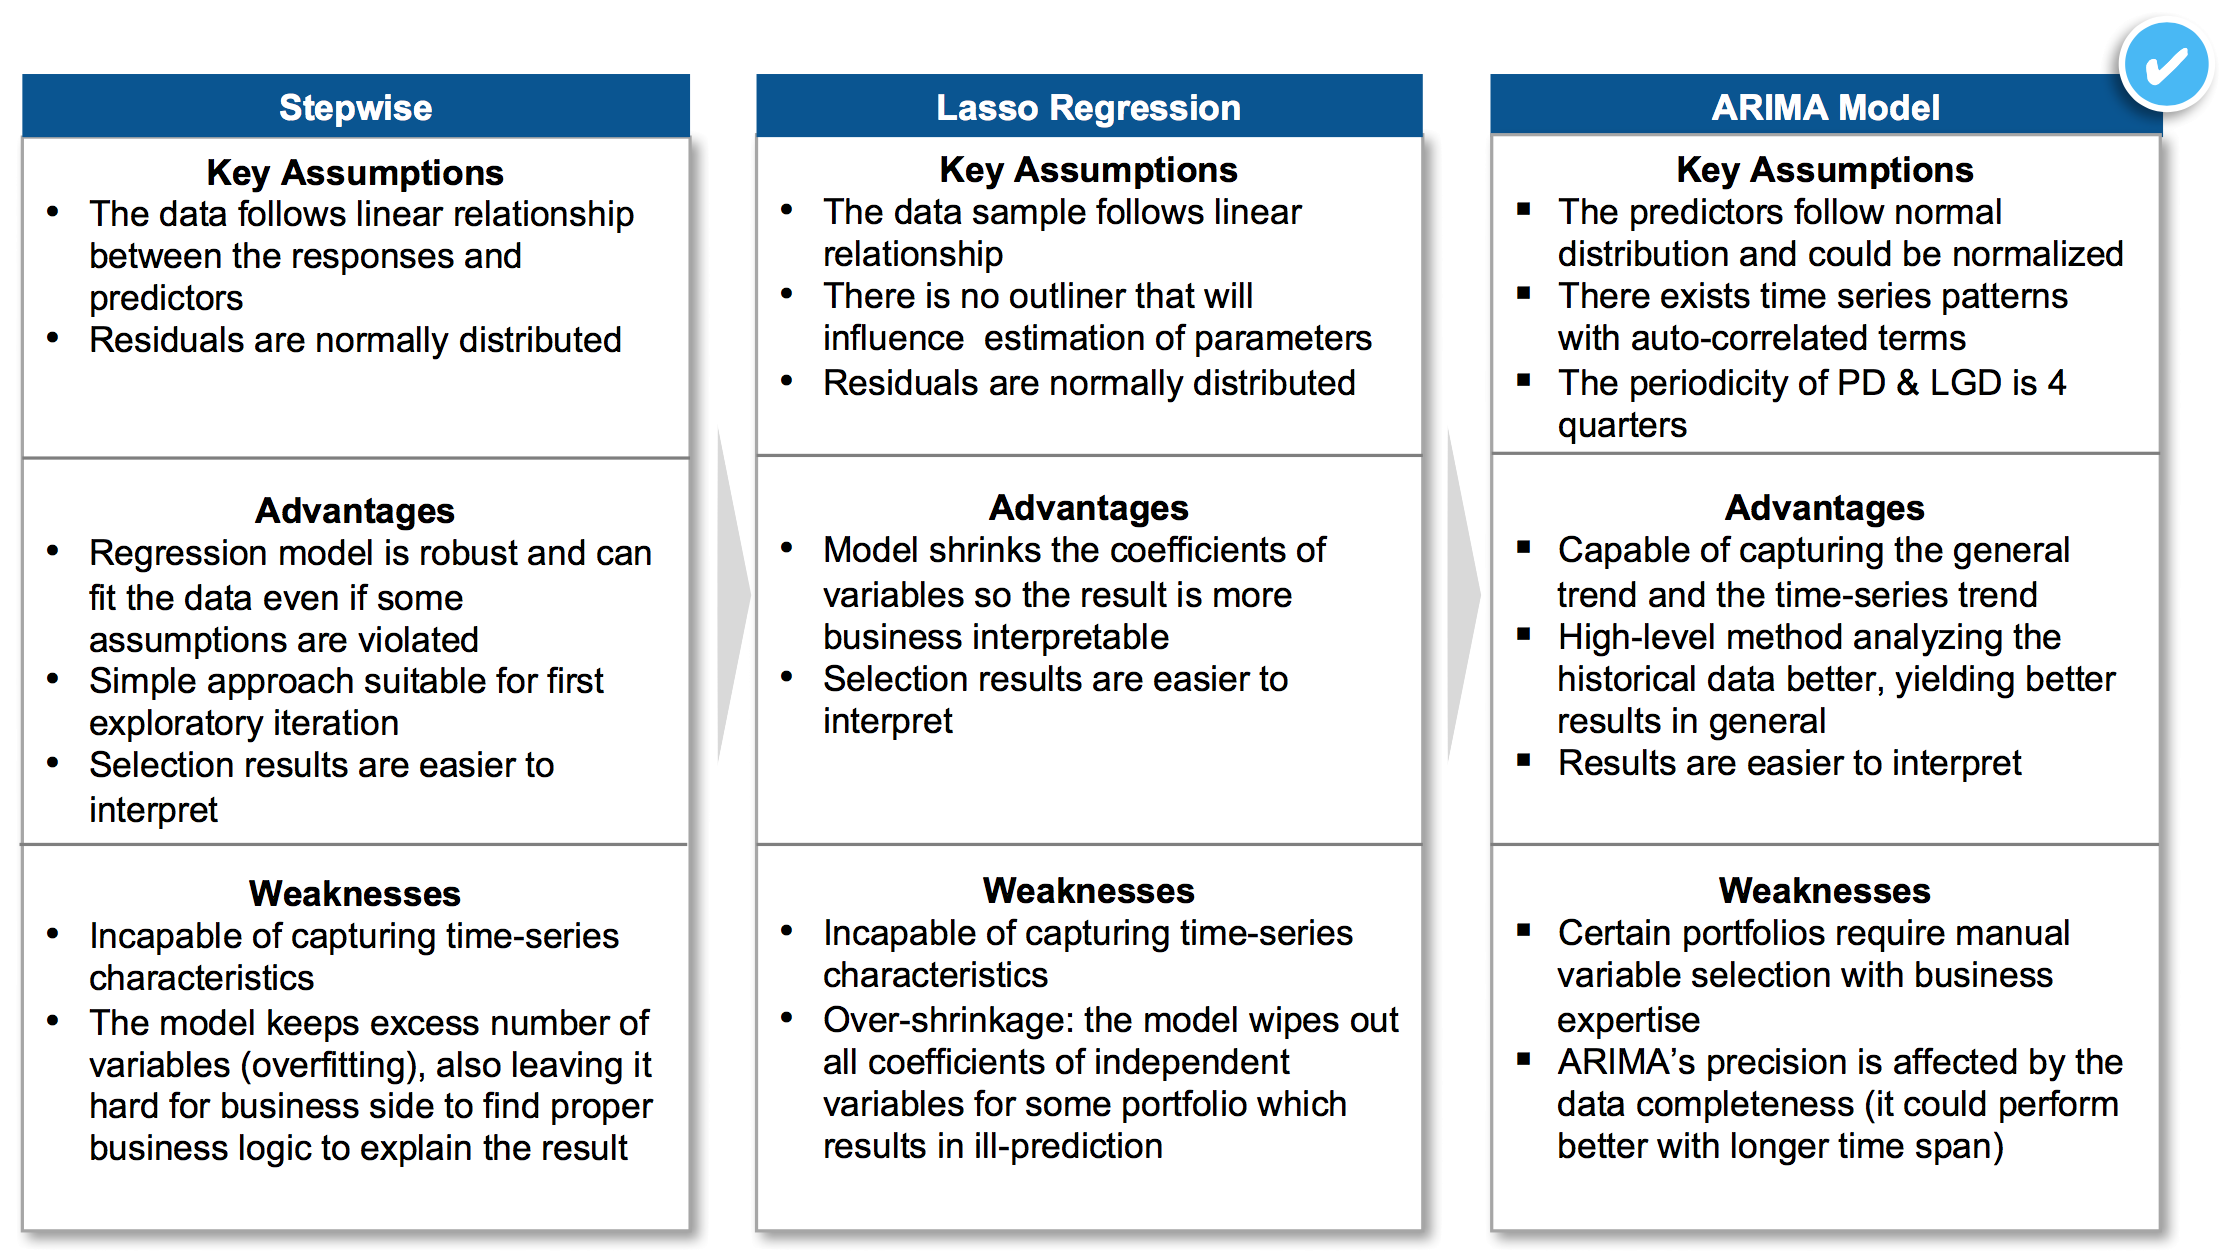
Figure 5 - ARIMA as the Champion Model
VI. Model & Results
To dive deeper into the model, model was fit using linear regression firstly to capture trend; then ARIMA on residuals; finally, forecast using Kalman Filter.
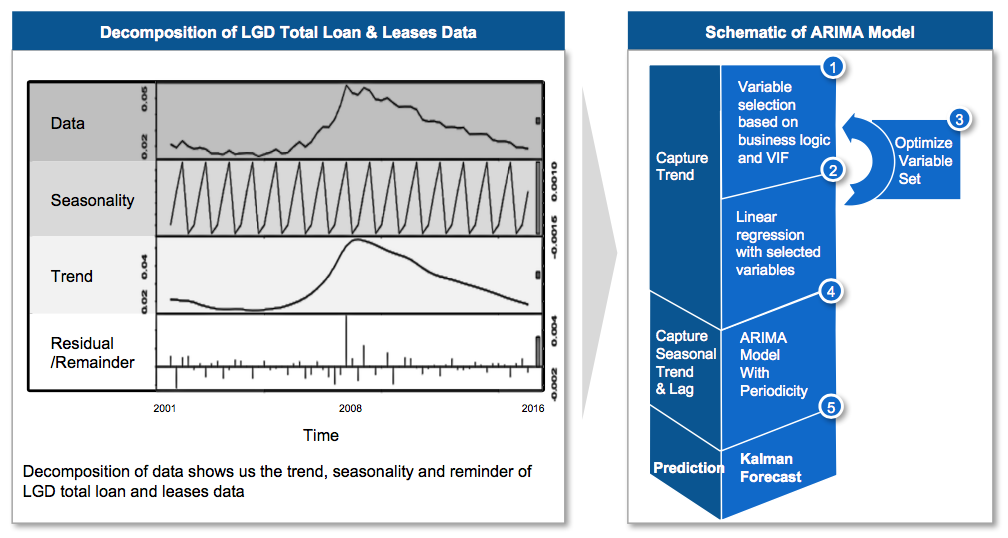
Figure 6 - Linear Model with ARIMA
Sample results for prediction (Multifamily Loans):
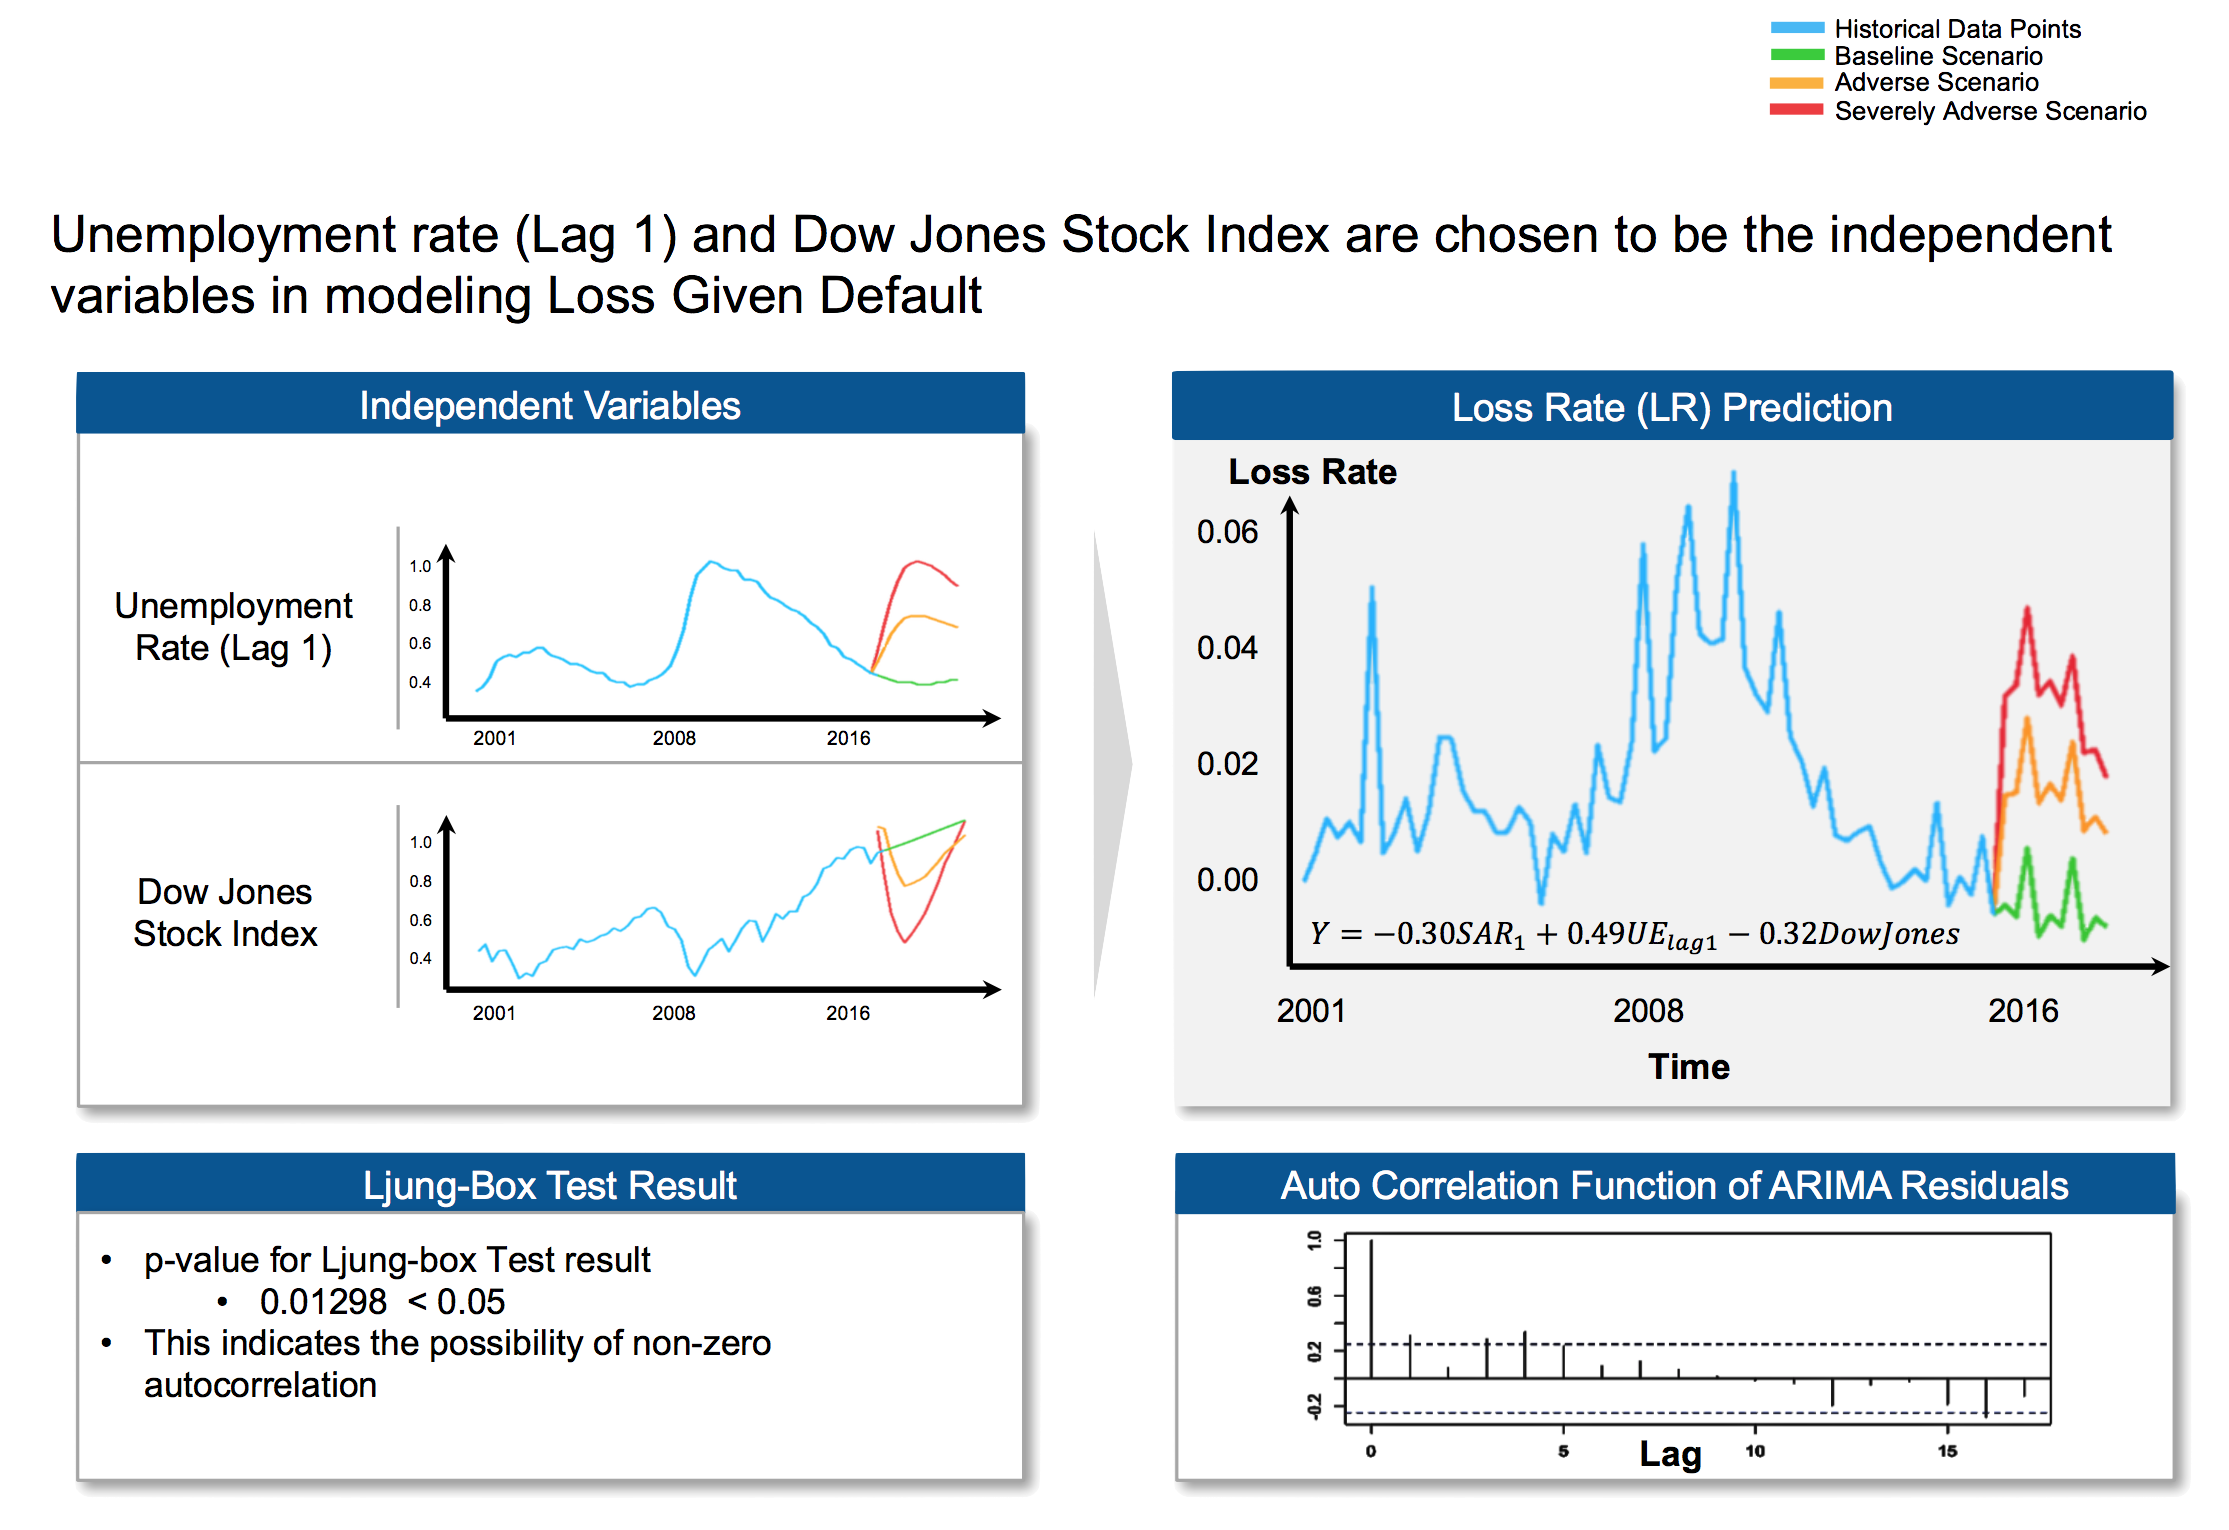
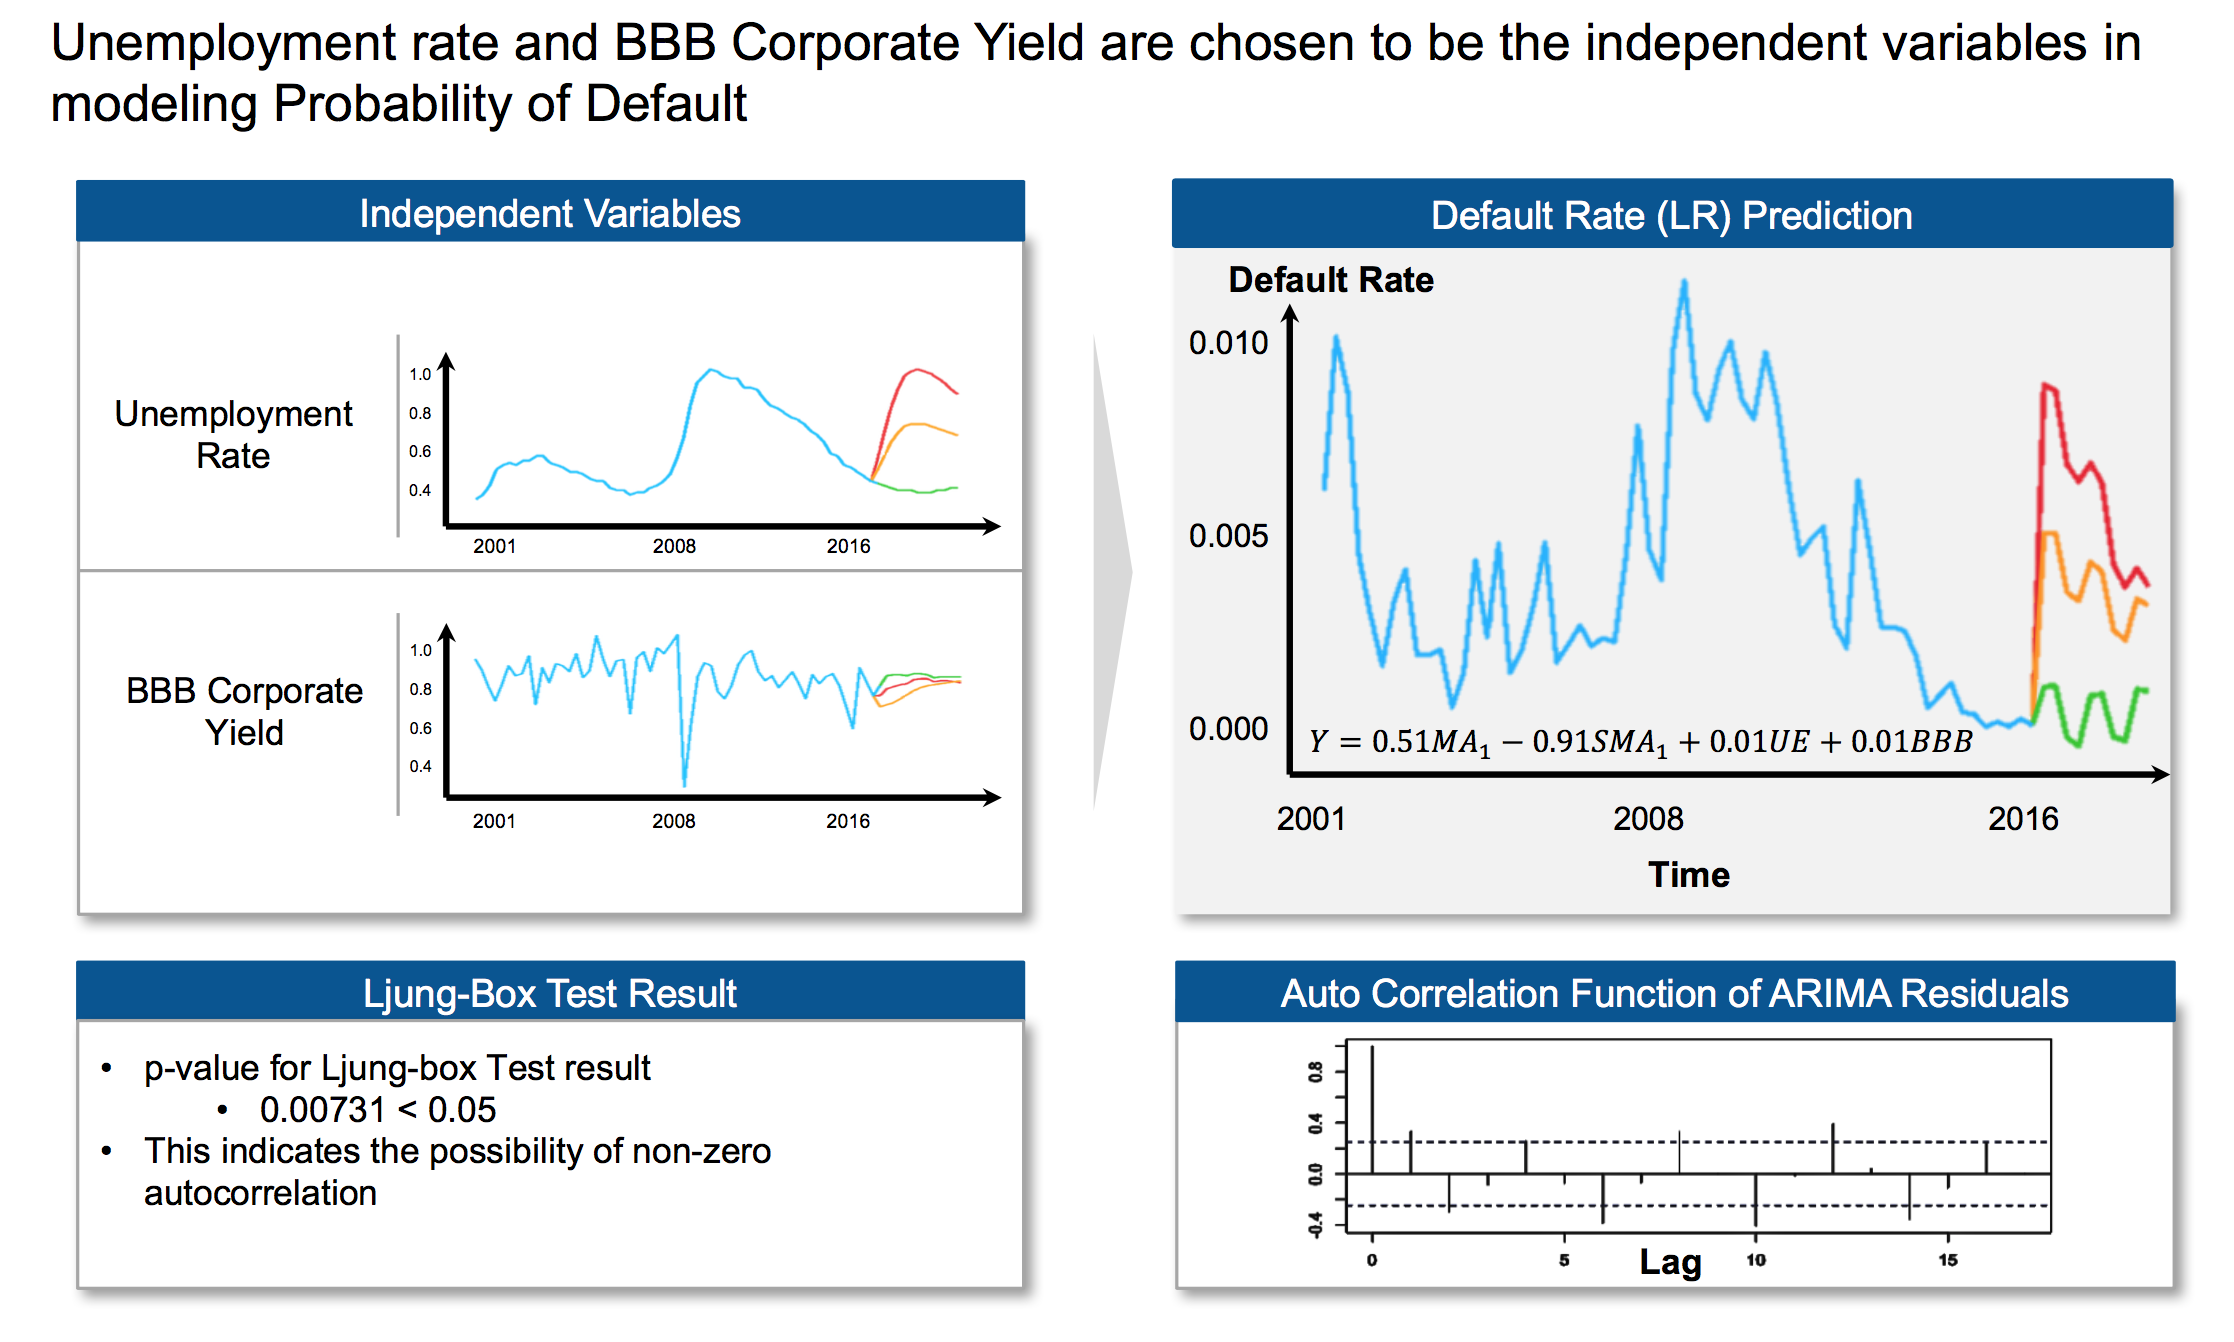
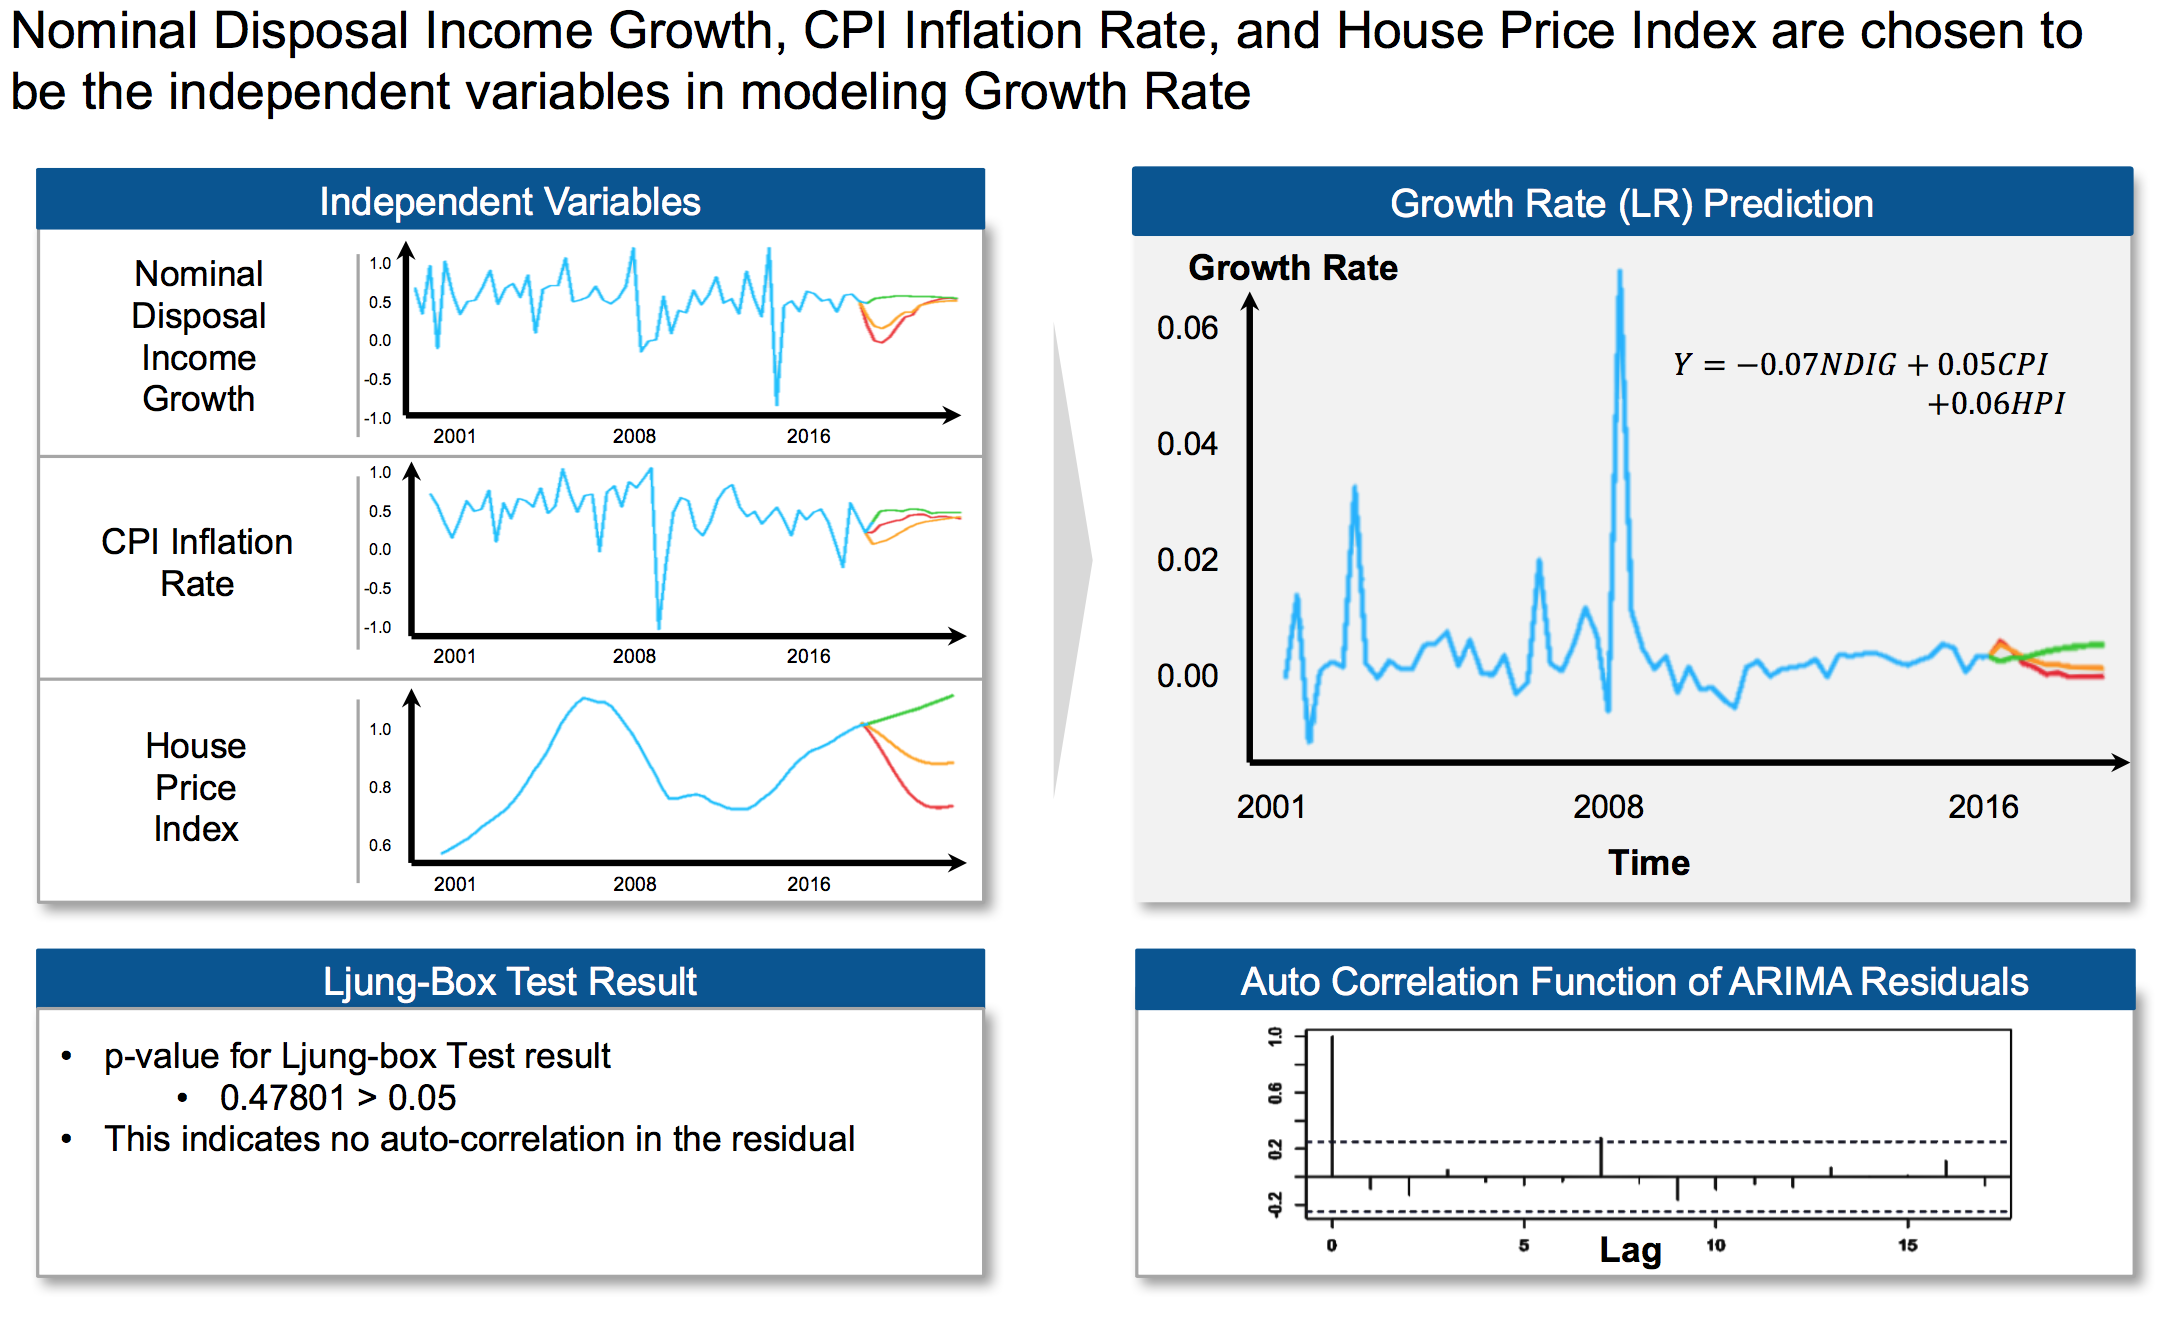
Figure 7 - Sample Results for Multifamily Loans
VII. Challenges & Learnings
1. Challenges
- Working with small data set
- Lack of complete historical data and small number of data points
- Prediction results might not be statistically significant
- Making key assumptions
- Choosing proxies for modeling
- Enforce seasonal structure on PD & LGD Model
- Evolving regulatory landscape
- New efforts to deregulate banks could change modeling requirements and needs
2. Learnings
- Data science topics
- Data Transformation & Imputation
- Variable Selection Framework
- Exploratory Data Analysis
- Time Series Analysis
- Credit risk management topics
- Stress-testing general knowledge
- Corporate credit risk analysis